


As I’ve stated in a previous blog post, I have two investment styles:
1. Buying undervalued and out of favor resource producing companies.
2. Holding high quality compounders that consistently grow FCF per share.
I want to discuss what I look for in both, and how to navigate these spaces. First and foremost, never make an emotional investment decision. Even when I get a tip from another investor that I respect, I never ape into their pick. I always do my own due diligence because I must have conviction myself.
Part 1 High Quality Compounders
When it comes to high quality compounders, there are qualitative and quantitative aspects to look for.
Qualitative Aspects:
1. Wide Moat (Almost Monopolistic):
a. High Barriers to Entry: Companies with high barriers prevent new entrants from easily competing in their industry. These barriers could include:
i. Exclusive Patents: Owning patents on critical products or technologies that are essential for providing a specific service or product.
ii. Regulatory Hurdles: Compliance with complex regulations or licensing requirements that deter new players.
iii. Significant Capital Requirements: Industries where substantial upfront investments are needed to establish a foothold.
b. Intangible Assets: These include:
i. Brands: Superior brand identity and customer loyalty that make it hard for competitors to replicate.
ii. Licenses: Exclusive licenses that protect production processes or intellectual property.
iii. Trademarks: Recognizable trademarks associated with quality and trust.
c. Cost Advantages: Companies that maintain low operating expenses relative to their sales can undercut competitors by offering lower prices.
d. Switching Costs: Businesses that create switching costs for customers have a wide moat. When customers invest time, effort, or money in a product or service, they are less likely to switch to a competitor. Examples include software companies with complex integration requirements or subscription-based services.
2. Pricing Power:
a. A company should have the ability to raise prices above the rate of inflation and customers will still pay for that product.
3. Economies of Scale:
a. As the company grows its revenue overtime, the companies operating margins should expand. This means that the business is properly implementing operating leverage. As a good business grows, its cost of producing an additional unit should decline.
b. The company should grow its revenue by increasing sales volume and price increases. It should not rely on expensive acquisitions.
4. Intelligent Deployment of Capital
a. Management should consider how capex and acquisitions effect earnings on a per share basis. They should not want to grow for growth’s sake. In other words, 10% share dilution for 8% earnings growth is a horrible deal. Also, taking on debt at a 9% interest rate when your return on capital employed is 6% is also a horrible deal. More on ROIC later.
b. The company should have some sort of capital return program via dividends and buybacks.
5. Not Capex Intensive
a. Ideally, the business should not require large amounts of sustaining capital or research and development for the business to keep functioning. However, this criterion is the one I am most lenient on, since there are wonderful businesses with wide moats, such as rail roads, that are capital intensive.
Quantitative Aspects:
The Business is Predictable: A business that consistently grows free cashflow per share and can hit the earnings targets set by management is not going to be hit with an unpredictability premium by the market. Great businesses generally can:
i. Grow FCF per share by 10% or more per year.
ii. Grow Revenue by 10% or per year.
iii. Has operating margins above 20%.
iv. Has a return on invested capital of at least 15%.
v. Ideally returns 30% to 50% of free cash flow to shareholders via dividends and buybacks.
The Importance if Return on Invested Capital: I’ll give a practical example of return on invested capital that I think investors of all experience levels could learn something from.
Investment Details:
The company buys a machine for $1000.
They pay $200 out of pocket.
The remaining amount ($800) is financed with debt at an 8% interest rate.
The corporate tax rate is 20%
Machine’s Performance:
After one year, the machine produces goods worth $100.
ROIC Formula:
ROIC = NOPAT / Invested Capital
NOPAT (Net Operating Profit After Tax) can be calculated as follows:
NOPAT = EBIT × (1 - Tax Rate)
Given the tax rate of 20%, NOPAT = $100 × (1 - 0.20) = $80.
Invested Capital remains the same:
Invested Capital = Debt + Equity
Debt = Total investment cost - Out-of-pocket payment = $1000 - $200 = $800
Equity = Out-of-pocket payment = $200
Invested Capital = $800 (debt) + $200 (equity) = $1000
ROIC Calculation:
ROIC = NOPAT / Invested Capital
ROIC = $80 / $1000 = 0.08 or 8%
Cash Flow:
Remember that 8% interest must be paid on the debt.
Cash Flow = 80 – 800*0.08 = 16
Recall the original equity invested was 200.
16/200 = 0.08, so free cash flow yield is 8%.
In other words, FCF Yield roughly equals ROIC.
Interpretation:
With the inclusion of taxes, the Return on Invested Capital (ROIC) is 8%.
This means that for every dollar invested, the company generated a return of 8 cents above the cost of capital.
If the company’s weighted average cost of capital (WACC) is less than 8%, it indicates that the investment is still creating value.
ROIC is indicative of free cashflow yield for new investments.
I apologize for this long example, but I really want you to think about financial metrics like ROIC through the lens of operating a business. Just to really drive the point home, let’s look at how this business could perform next year, and this time lets add in a 2% dividend.
Investment Details:
The company still has the $1000 machine and reinvests the $16 of retained earnings into smaller less expensive machines.
The company now has 216 in equity.
The $800 is still financed with debt at an 8% interest rate.
The corporate tax rate is 20%.
The company decides to pay a 2% dividend on equity.
Dividends are distributed to shareholders from the net income.
Reinvestment and EBIT Growth:
Additional investments will increase the invested capital.
Additionally, let’s assume that the reinvestment led to EBIT growth and that the business had natural organic growth from having more customers come to their business.
ROIC Calculation:
First, let’s find NOPAT for the next year:
NOPAT = EBIT × (1 - Tax Rate)
Assuming EBIT increased due to reinvestment (let’s say EBIT = $120), and the tax rate is still 20%, NOPAT = $120 × (1 - 0.20) = $96.
Next, let’s determine the new Invested Capital:
Invested Capital = Debt + Equity
Debt remains the same: $800
Equity = Previous equity + Retained earnings (reinvested)
Previous equity = $216
Retained earnings = Net income – Dividends
NOPAT = 96, Interest Expense = 64
Net income = NOPAT – interest expense = $32
Dividends = Equity × Dividend rate = $216 × 0.02 = $4.32
Retained earnings = $32 - $4.32 = $36.32
New equity = Previous equity + Retained earnings = $216 + $36.32 = $252.32
New Invested Capital = $800 (debt) + $252.32 (equity) = $1052.32
Finally, calculate the new ROIC:
ROIC = NOPAT / New Invested Capital
ROIC = $96 / $1052.32 ≈ 0.0912 or 9.12%
Cash Flow
For this example, net income equals cash flow, so the cash flow is $32 dollars. Since last year’s equity was $216, this implies a FCF yield of 14.81%.
Of the free cash flow, $4.32 was paid to shareholders via a dividend.
Interpretation:
Sales were accelerated by a combination of organic growth and reinvestment.
With EBIT growth due to reinvestment, the calculated ROIC for this year is approximately 9.12%.
This reflects the efficiency of capital utilization, considering both interest expense and dividends.
I sincerely hope that this example helped you understand ROIC better, and how getting ROIC right leads to revenue growth, free cash flow growth, and returns for shareholders.
As I stated earlier, I like to see a consistent annual ROIC above 15%. This will ensure strong free cash flow growth and demonstrates that management can make intelligent investments. This is crucial since this is how capital can compound itself within a company.
Valuation: How to think about valuation of compounders
First and foremost, you want to view the valuation of a compounder through the lends of its free cash flow yield. This free cash flow yield will be compared to the U.S. ten-year yield, which currently sits at 4.28%.
To explain valuation, I would like to start off with and example. Let’s say Stock 1 is trading at a 3% free cash flow yield and is expected to grow FCF per share at 11% per year while Stock 2 is trading at a 2.8% FCF yield and is expected to grow FCF at 15% per year. How do these stocks FCF yield compare to the US Ten Year Bond over the years?
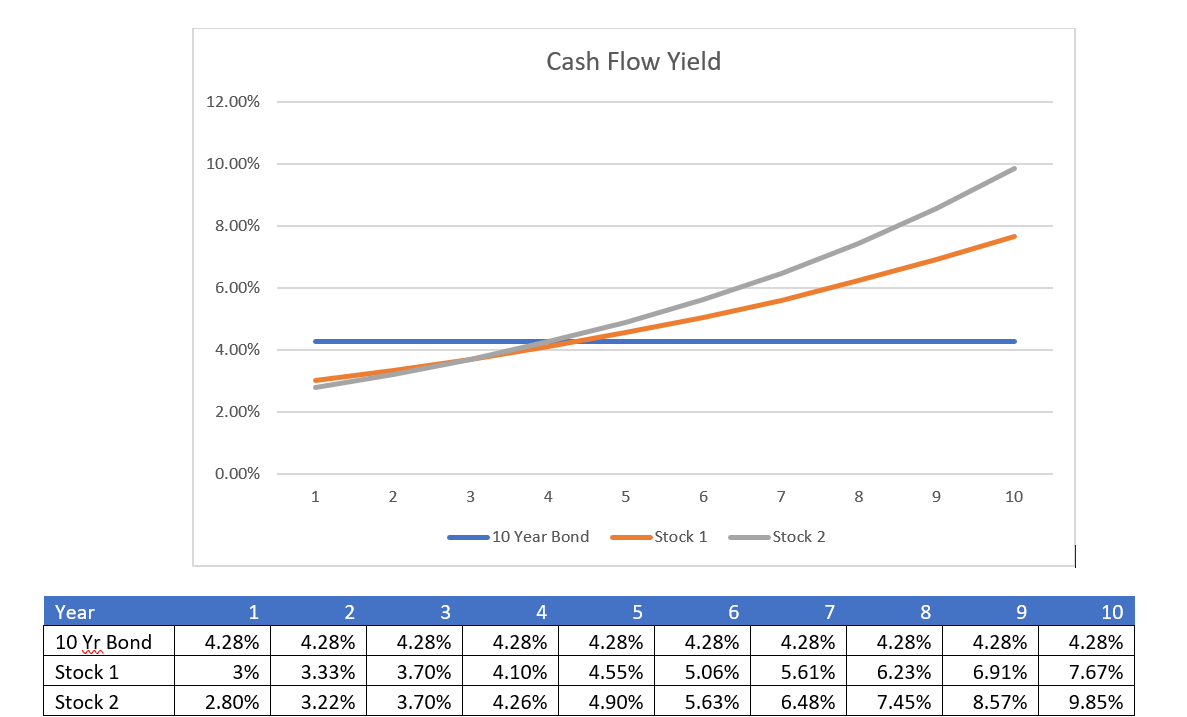
If you knew that this would indeed be the future of these companies, both of these companies would be considered undervalued, even though their current free cash flow yield is lower than the U.S. ten-year yield.
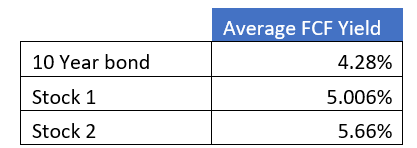
You might see the average FCF yield of these stocks and quickly gloss over them. After all, there are stocks paying 7% plus dividends, therefore an average yield of 5.66% for ten years might not sound appealing. Therefore, let me be clear, average FCF yields will not be indicative of returns. Let’s continue with the example, using Stock 2:
Initial FCF Yield: The stock’s current FCF yield is 2.8%.
FCF Growth Rate: The FCF is growing at 15% per year for the next 10 years.
Current Stock Price: The current stock price is $10.
Current FCF per share based on yield and stock price: $0.28.
Now, we want to find the geometric average return over 10 years. Here’s how we can calculate it:
Future FCF Yield: Let’s say at the end of 10 years, the stock will be trading at a FCF yield of 4%. This would be an example of multiples compression.
FCF Growth Factor: The growth factor for FCF over 10 years is given by: (1.15)^10 = 4.0455. Current FCF = 4.0455* $0.28 = $1.13.
Future Stock Price: We can estimate the future stock price using the FCF yield: $1.13/0.04 = $28.32 per share.

Conclusion: By buying a 2.8% yield at with 15% FCF growth, even with multiples compression, still resulted in a 10.9% average annual return. I hope this helps with how you view valuation of compounders.

Growth: How the Market is Pricing it
As demonstrated in the previous section on valuation, returns are heavily dependent upon growth. This is something that you, the intelligent investor, must determine for yourself. However, I can teach you what level of growth the market is pricing in, and then you can determine if you think that growth rate is reasonable.
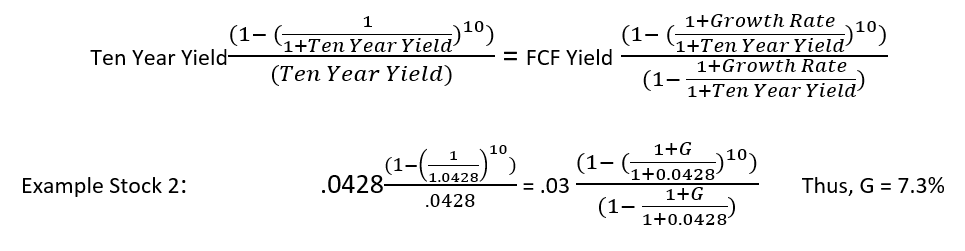
This gives us we can conclude that the market is pricing Stock 2 at a 7.3% growth rate. If you believe this stock will have greater than 7.3% growth, then you’ll believe it to be undervalued.
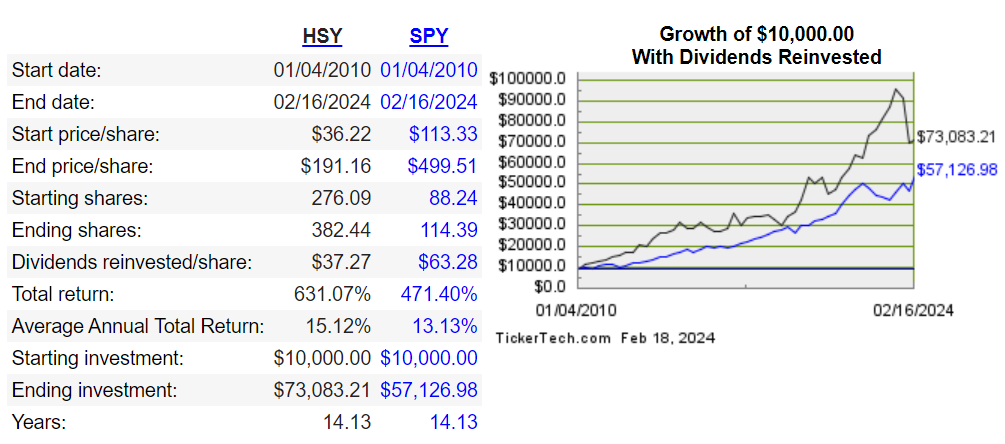
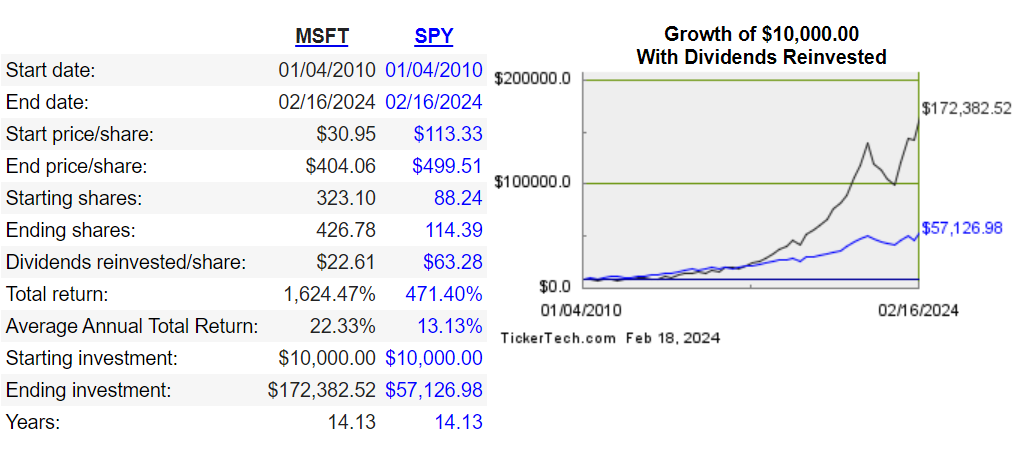
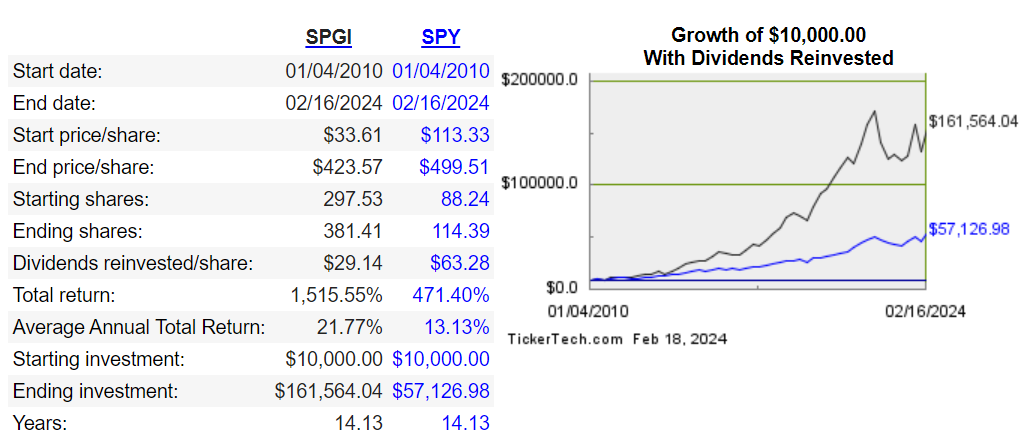
Examples of high-quality compounders from various sectors:
Part 2 Undervalued and Out of Favor Resource Producers
I will release this part soon. When I discuss part 2, I will also go over my most recent investment in Parex Resources.